Predicting Hawai‘i water demand under climate change
Background
How will climate change affect supply and demand for water? The answer to this question is complex, uncertain, and depends critically on location and context. On the supply side, there is great uncertainty about future rainfall and aquifer recharge in Hawai‘i, but climate also affects water demand. In most of the world, the largest uses of water are for agriculture, landscapes, and cooling towers used for air conditioning. These demands for water clearly depend on precipitation, temperature, and prevailing climatic conditions. This project focuses on the effects of temperature on water demand and consumption.
Project Summary
A simple way to measure the effects of temperature on water consumption is to compare the water used against average temperature over a monthly billing period, while controlling for other variables. However, this method largely ignores non-linear, within-period variation in weather, which may play an important role in determining the quantity of water a household or business consumes during that period. For instance, two months may have the same calculated mean temperature, but one month might have included wild fluctuations between hot and cold temperatures, while the temperature may have remain much steadier during the other month. If a simple mean temperature were used, these two months would be regarded as similar climatic situations but may actually represent periods with drastically different conditions for water consumption.
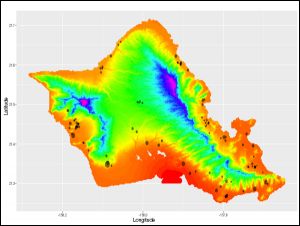
To account for this within-period variation in weather, we can instead compare water consumption to the distribution of temperatures over a given monthly billing period. Using weather stations and baseline data for O‘ahu, we create hourly temperature maps for the island, at 250-m resolution (Fig. 1). Next, we merge premises-level water use data and premises characteristics data (e.g. commercial, industrial, residential, square footage, etc.), and match consumers to a grid cell on the island. This allows us to create individual temperature distributions for each premises and each billing period, which are then used to estimate detailed, non-linear relationships between water use and weather conditions for various consumer types. These relationships can then help inform policymakers about water resource needs under various developmental and climate change scenarios.
PROJECT DETAILS
FUNDED:
FY2016
PI:
Michael J. Roberts
Associate Professor of Economics, UH Mānoa
Graduate Scholar:
Nathan DeMaagd
Department of Economics, UH Mānoa